
An OpenCOBOL program calling Gnuplot to graph a table of reciprocals to display one aspect of Euler's number, e. 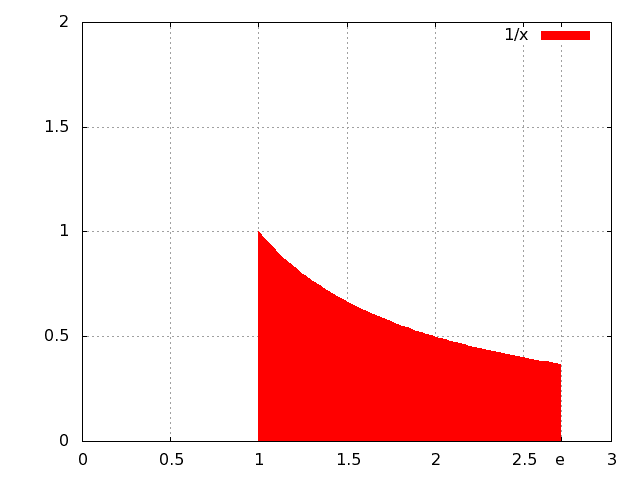 …
…
Well met,
This short OpenCOBOL program calculates an array of reciprocals and uses gnuplot to show the magic area.
 OCOBOL >>SOURCE FORMAT IS FIXED
       *> ***************************************************************
       *> Author:    Brian Tiffin
       *> Date:      29-May-2009, updated 05-May-2011
       *> Purpose:   Plot Euler's number (using integral of 1 over x)
       *> Tectonics: requires access to gnuplot. http://www.gnuplot.info
       *>            cobc -Wall -x ploteuler.cob
       *> OVERWRITES ocgenplot.gp, ocgpdata.txt and images/euler.png
       *> ***************************************************************
        identification division.
        program-id. ploteuler.

        environment division.
        input-output section.
        file-control.
            select scriptfile
                assign to "ocgenplot.gp"
                organization is line sequential.
            select outfile
                assign to "ocgpdata.txt"
                organization is line sequential.

        data division.
        file section.
        fd scriptfile.
           01 gnuplot-command pic x(82).

        fd outfile.
           01 outrec.
              03 x-value   pic -z9.999.
              03 filler    pic x.
              03 y-value   pic -z9.999.

        working-storage section.
        01 xstep   pic 9v99999.
        01 x       pic 9v99999.
        01 recip   pic 9v99999.

        01 gpcmds  pic x(400) value is
            "set style fill solid 1.0;                         " &
            "set grid;                                         " &
            "set xtics add ('e' 2.71828182);                   " &
            "plot [0:3] [0:2] 'ocgpdata.txt' using 1:2 \       " &
            " with filledcurves below x1  title '1/x';         " &
            "set terminal png;                                 " &
            "set output 'images/euler.png';                    " &
            "replot                                            ".
        01 line-cnt pic 999.
        01 gptable.
           05 gpcmd pic x(50) occurs 8 times.

        01 gplot   pic x(40) value is 'gnuplot -persist ocgenplot.gp'.
        01 result  pic s9(9).

       *> ***************************************************************
        procedure division.
        display function e end-display

       *><* Create the script to plot the area of Euler's number
        open output scriptfile.
        move gpcmds to gptable
        perform varying line-cnt from 1 by 1 until line-cnt > 8
            move gpcmd(line-cnt) to gnuplot-command
            write gnuplot-command end-write
        end-perform
        close scriptfile

       *><* Create the reciprocal data
        open output outfile
        move spaces to outrec
        compute xstep = function e / 100 end-compute
        perform varying x from 1 by xstep
            until x > function e
                move x to x-value
                compute recip = 1 / x end-compute
                move recip to y-value
                write outrec end-write
        end-perform
        close outfile

       *><* Invoke gnuplot
        call "SYSTEM" using gplot returning result end-call
        if result not = 0
            display "Problem: " result end-display
            stop run returning result
        end-if

        goback.
        end program ploteuler.
which produces
The area in red is exactly one. Or would be if the program paid more attention to the xstep accuracy.
Cheers,
Brian